- Statistical Reports
- Detailed Reports
- Service Level Agreement Reports
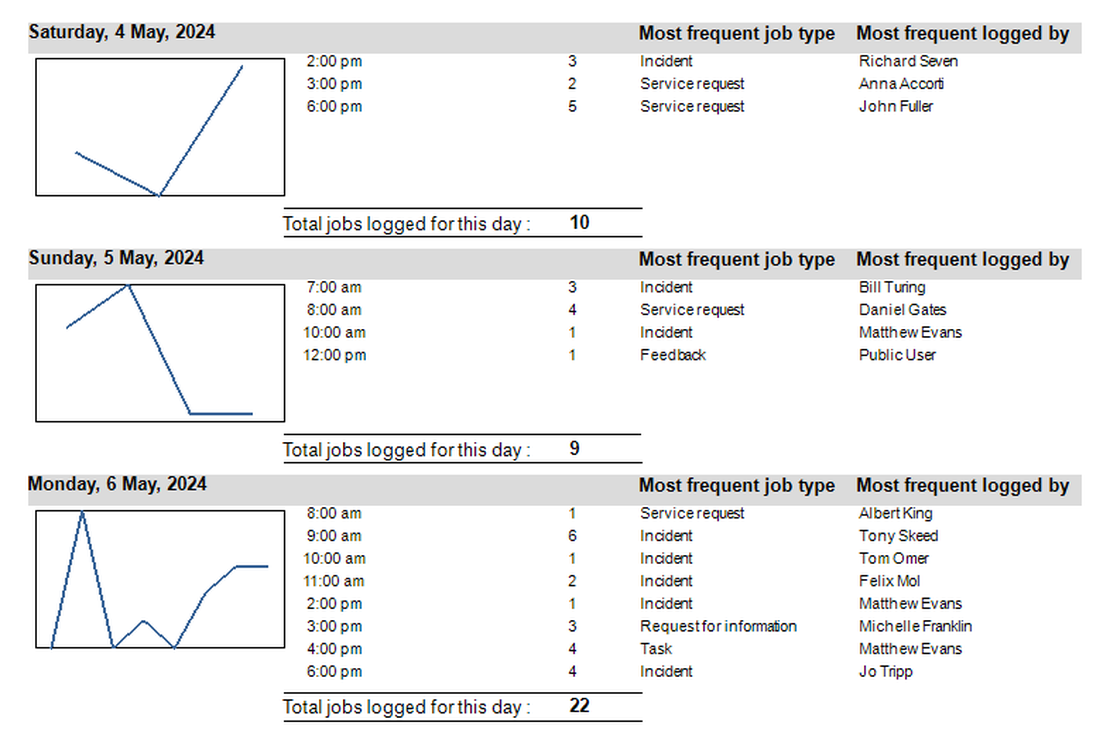
- Time Distribution (trend analysis) Reports
- Client Reports
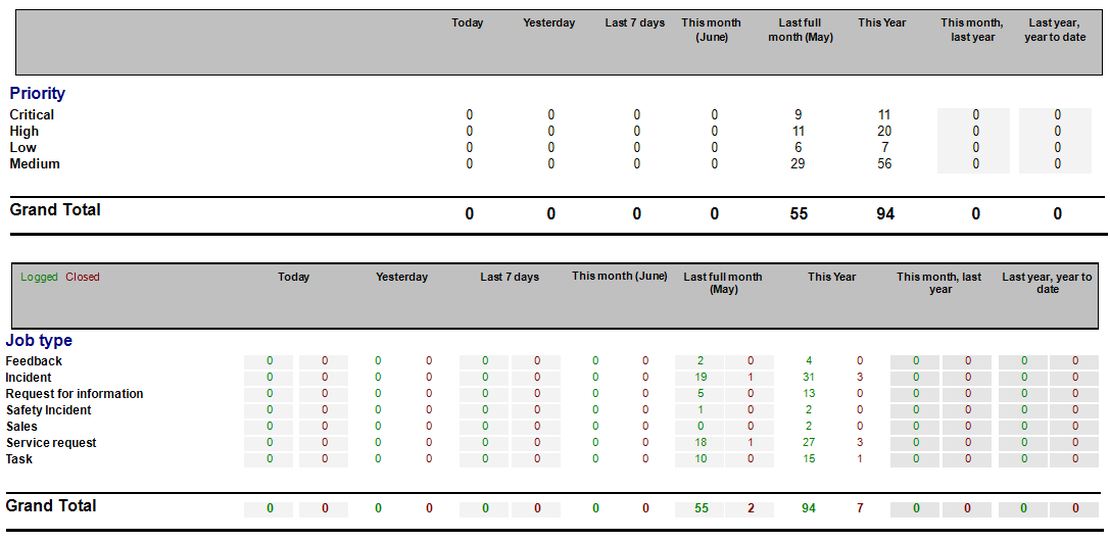
- Job Summary Reports
- Category Comparison Reports
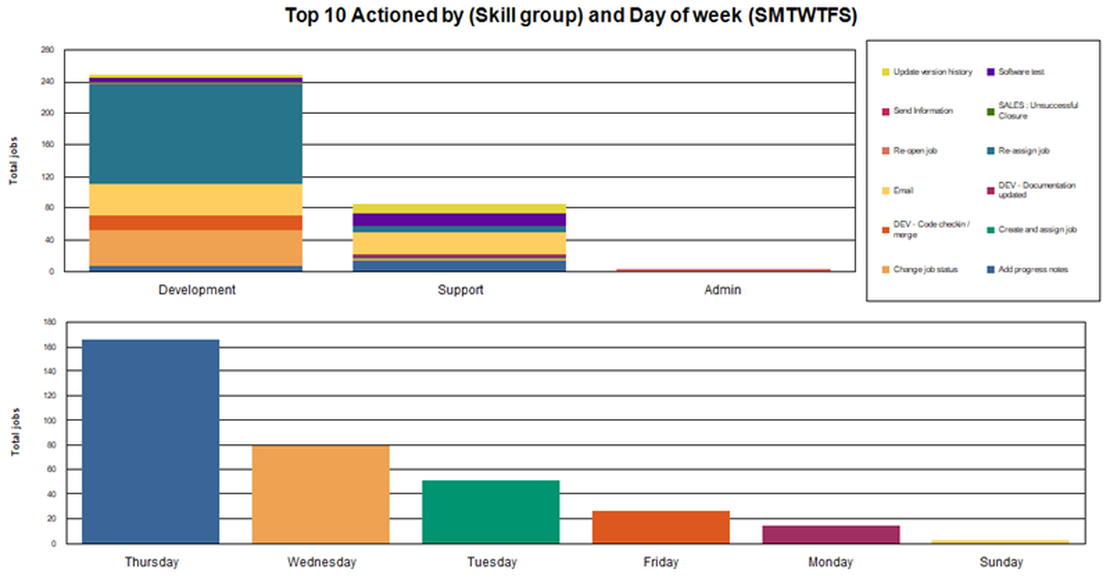
- “Top 10” Reports
- Asset Reports
Service Management Reporting
A vital key to continual service improvement (CSI) is responding to what your data is telling you.
Without knowing where you are, and where you have been, it is pretty hard to figure out where you are going. This is where effective reporting, statistics and analysis can really help.
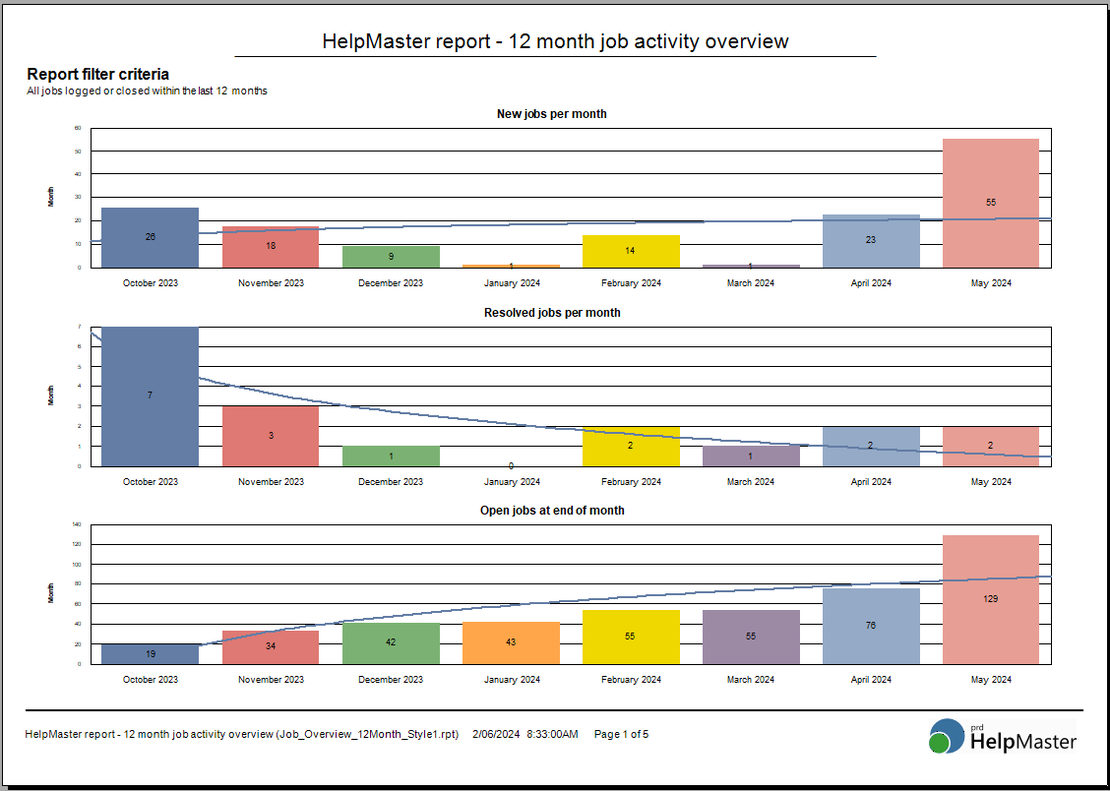
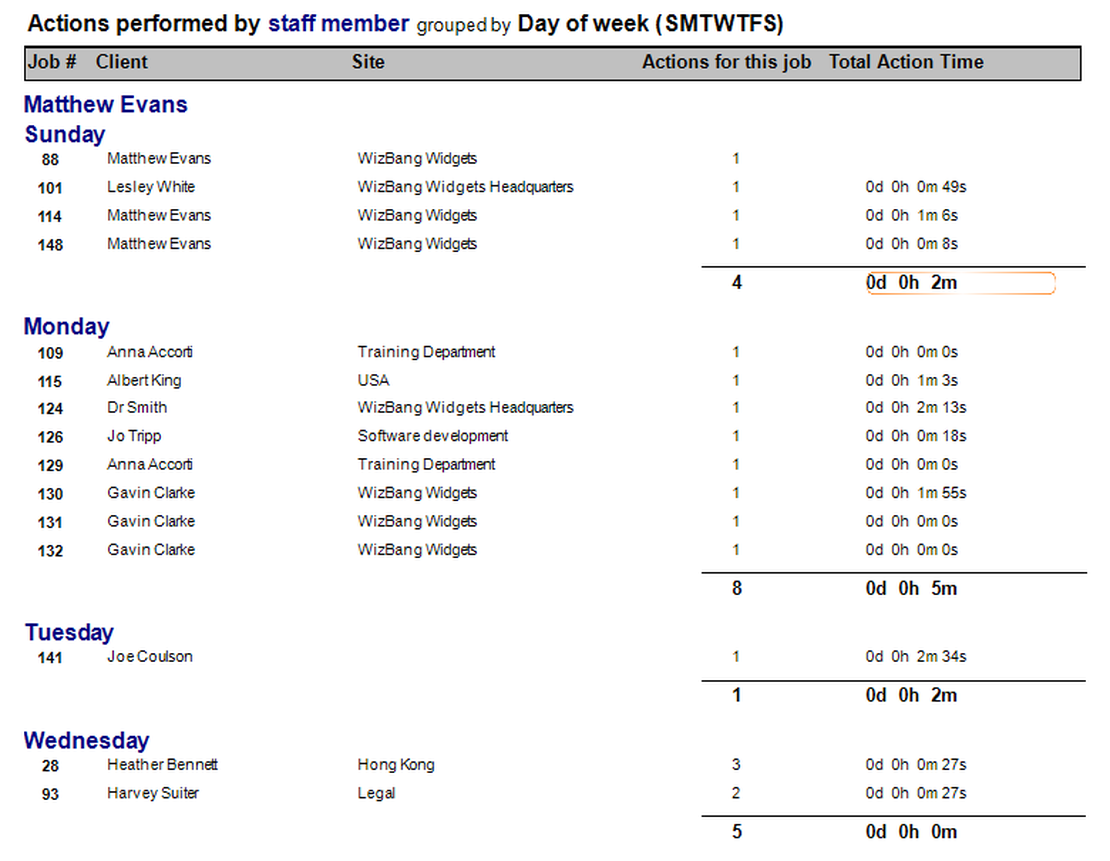
HelpMaster ships with dozens of different reports to cover all of your help-desk and service management needs. Some are detailed reports - displaying all aspects of an incident or problem, others are statistical in nature - showing trends and what ifs?
Get a demo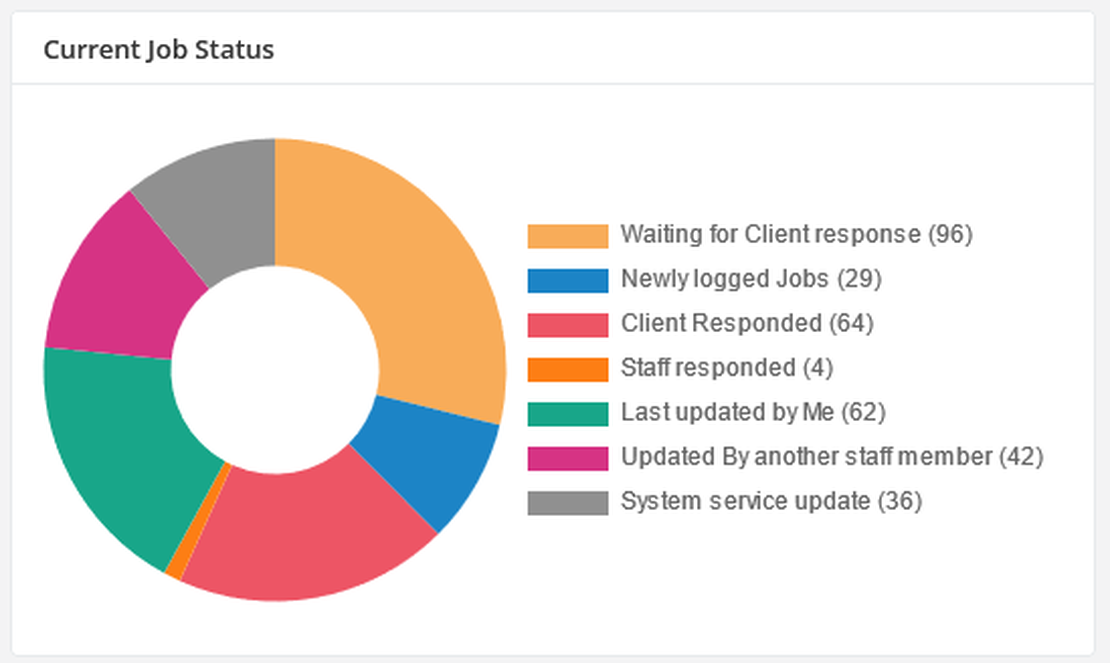
Reports for everyone
All of the reports that ship with HelpMaster are created using the award-winning, industry standard Crystal Reports. This means that if you currently have a copy of Crystal Reports, you can create and modify existing reports to meet your exact business requirements.
Custom report development is easy as the HelpMaster database contains many pre-built reporting views and queries, so all you have to do in most cases is simply point any reporting tool to a view, and then format the report to how you want it.
Report Categories
Report Styles
- Summary / line reports
- Full text detail reports
- Chart and Graphs
- Cross-tab reports
- Drill-down reports
- PowerBI interactive dashboards
- Excel export
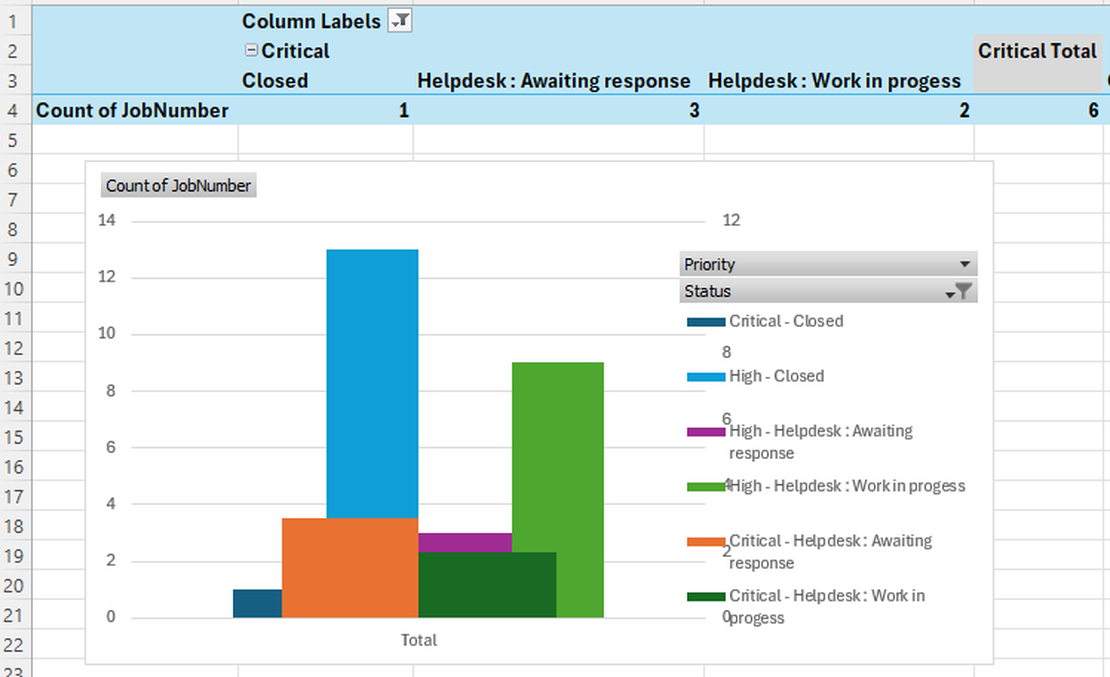
- Excel Pivot Tables
- Custom Reports
Report options
Crystal Reports is a powerful and popular reporting tool.
HelpMaster ships with over 100 different types of Crystal Reports files that cover many aspects of helpdesk, service-desk, asset management, knowledge management, customer satisfaction, and staff activity reports.
Use the out-of-the box reports, or modify existing report to create your own custom reports.

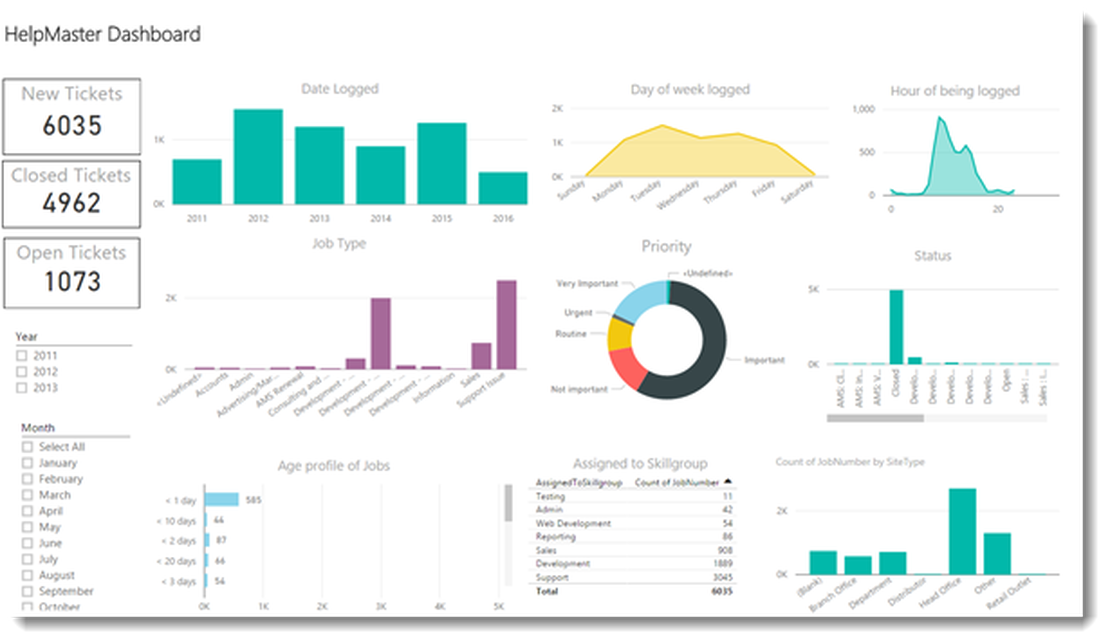
PowerBI is the leading reporting and dashboarding tool from Microsoft that allows you to visualize and drill into your data in many ways.
Slice, dice and chop your way into statistics, trends, patterns and more.
HelpMaster ships with a PowerBI dashboard that you can easily modify and extend to suit your reporting needs.
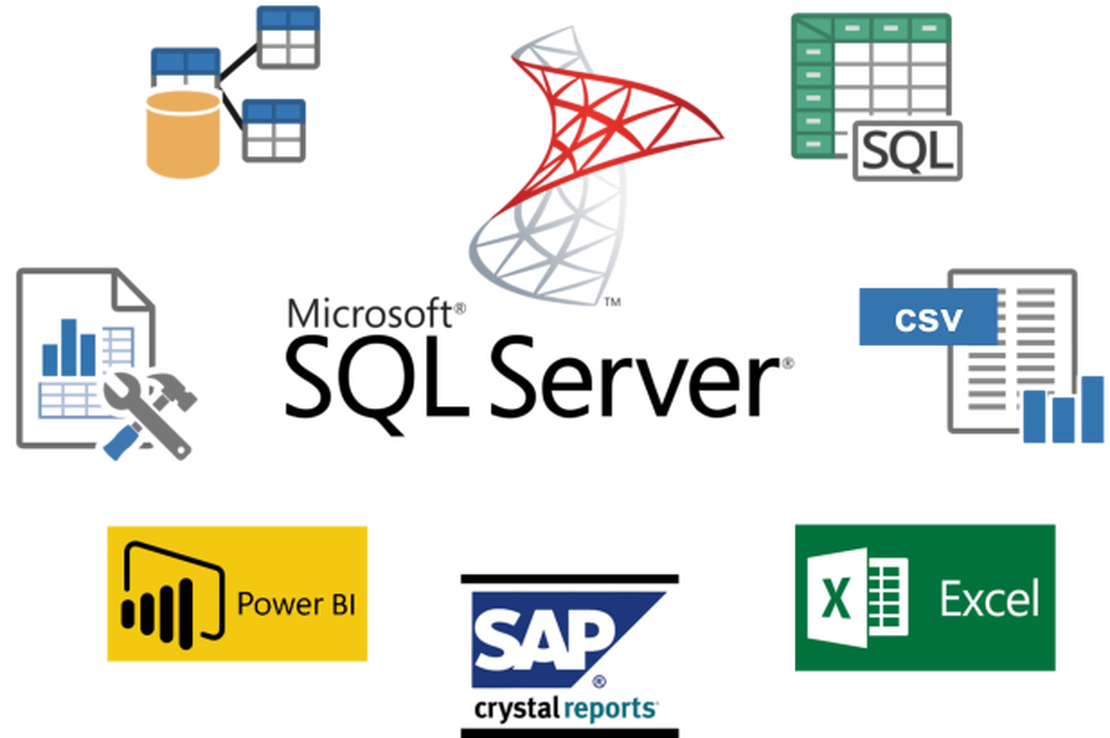
Microsoft Excel is also a very popular option for viewing and working with data. HelpMaster data is easily exported into CSV format directly from the product, or better still, connect Excel directly to the HelpMaster SQL Server database to create spreadsheet data, pivot tables, custom charts and other Excel-based data.
Report Examples
Use the built-in reports, or create your own from your own on-premise SQL Server database.
HelpMaster ships with pre-built reporting queries that thake the guess-work out of understanding the database schema. Simply connect to a report query, and use the fields that you need.
When you have your own data on-premise, your reporting potential is in your hands
HelpMaster is an on-premise solution which means that you are in complete control of your data.
Access your Microsoft SQL Server database any time you like, in any way to get the data you need.
Use the built-in reporting queries, or build your own to create new reports or integrate with other products and reporting tools.
